


Maintaining proper salinity levels is key to keeping oysters healthy, promoting growth, and reducing disease risks. Oysters thrive in salinity ranges of 10–20+ ppt, with 8 ppt being the minimum for growth. Low salinity slows growth but reduces disease, while high salinity encourages faster feeding but increases disease risk. Regular monitoring helps balance these factors and protect oyster populations.
Key Takeaways:
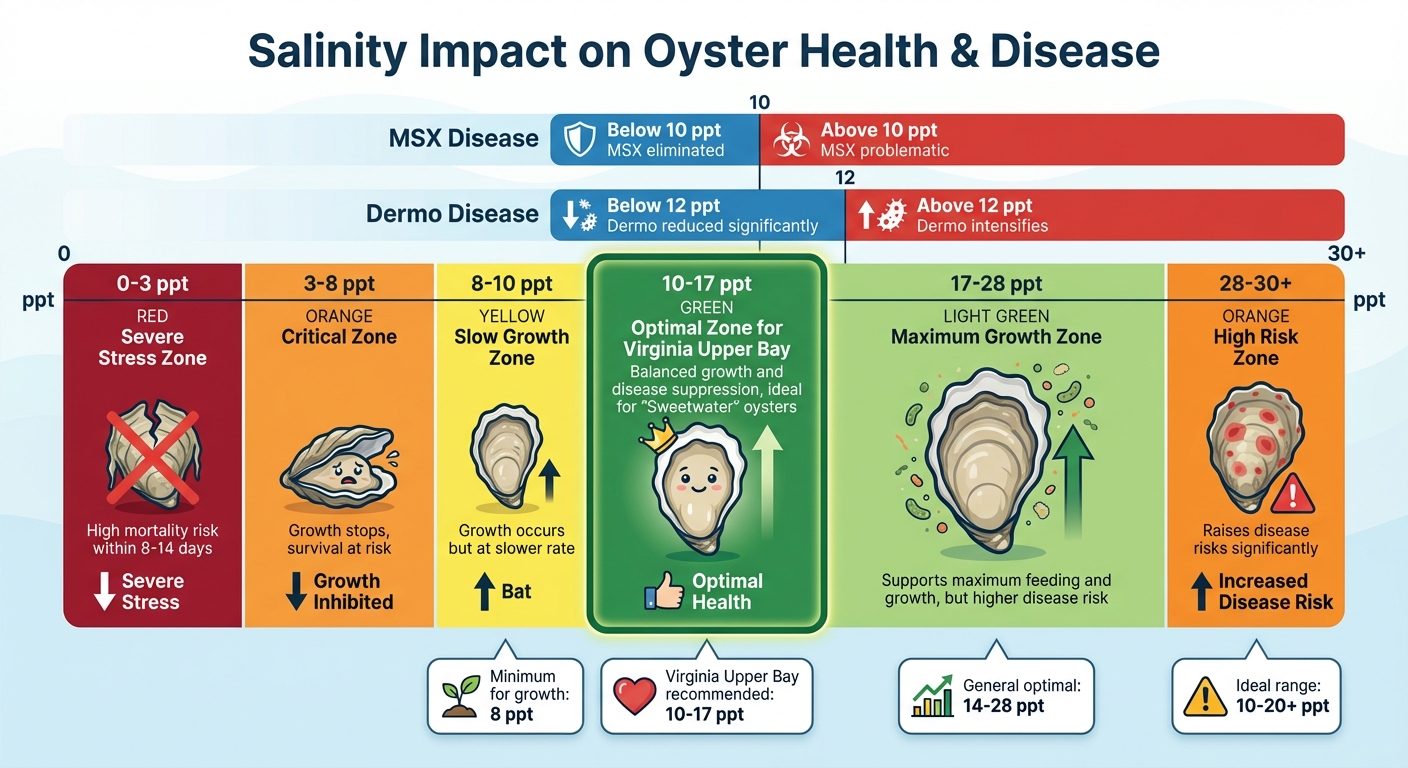
- Ideal Salinity: 10–20+ ppt; below 8 ppt halts growth, and above 30 ppt raises disease risks.
- Low Salinity Benefits: Reduces MSX (<10 ppt) and Dermo (<12 ppt) but slows growth.
- High Salinity Risks: Encourages growth but increases vulnerability to parasites and diseases like MSX and Dermo.
- Monitoring Tools: Use refractometers, conductivity probes, and data loggers for accurate measurements.
- Actionable Steps: Weekly checks, consistent depths, and immediate action during extreme weather events minimize risks.
How Salinity Affects Oyster Health and Growth
Optimal Salinity Ranges for Oyster Health and Disease Prevention
Salinity plays a central role in oyster health, influencing their feeding, growth, and ability to resist diseases. As osmoconformers, oysters adjust their internal salt levels to match their surroundings. However, rapid changes in salinity can stress them, making it crucial to maintain levels within specific optimal ranges.
This is why consistent salinity monitoring is essential for successful oyster farming.
"Salinity is one of the most important environmental factors dictating successful cultivation and production of oysters in estuarine systems."
- Shumway, 1996
Low salinity has its pros and cons. While it can reduce the risk of diseases like MSX (below 10 ppt) and Dermo (below 12 ppt), it also slows down feeding and growth. This trade-off means farmers must carefully balance salinity levels to ensure healthy oysters.
Recommended Salinity Ranges for Oysters
For Eastern oysters, salinity levels between 14–28 ppt are often considered ideal for growth and productivity. However, in regions like Chesapeake Bay, oysters thrive at slightly lower salinities. For example, in Virginia's Upper Bay Western Shore, including the Little Wicomico River, the recommended range is 10–17 ppt. This range supports healthy growth while naturally suppressing disease.
Oysters raised in this "Sweetwater" range are featured in products like Little Wicomico Oyster Co.'s Blackberry® Reserve Oysters and Blackberry Oysters, available year-round.
Problems Caused by Low or High Salinity
When salinity strays from the recommended ranges, oysters face serious challenges. Extremely low salinity levels (below 3 ppt), often caused by heavy rainfall or spring freshets, can lead to rapid mortality. For instance, a 2016 study by the Virginia Institute of Marine Science (VIMS) exposed Eastern oysters to salinities of 2.5–2.7 ppt. Mortality rates peaked between days 8 and 14, and reproductive activity during summer trials pushed mortality even higher - 53% compared to 23% in April.
High salinity, on the other hand, encourages faster feeding and growth but increases the risk of parasitic infections and diseases. MSX becomes more problematic above 10 ppt, while Dermo intensifies significantly above 12 ppt. Warm temperatures combined with high salinity can further exacerbate disease outbreaks, posing a serious threat to oyster populations.
In Virginia’s estuarine systems, maintaining precise salinity levels is essential to balancing growth and disease management.
| Salinity Level (ppt) | Impact on Oyster Health & Disease |
|---|---|
| <3 | Severe stress; high mortality risk within 8–14 days |
| <10 | Eliminates MSX; slower growth rates |
| <12 | Reduces Dermo intensity significantly |
| 10–17 | Ideal for Virginia’s Upper Bay; balanced growth and disease suppression |
| 14–28 | Supports maximum feeding and growth; higher risk of MSX and Dermo |
sbb-itb-5051793
Equipment Needed for Salinity Monitoring
Having the right tools is key to ensuring accurate salinity monitoring. This not only helps protect oyster health but also improves productivity. Whether you're doing quick checks or need continuous data, there's a range of equipment to suit your needs.
Handheld Refractometers and Probes
Refractometers offer a straightforward way to measure salinity in aquaculture. These optical tools determine the refractive index of water, which shifts based on salt concentration. With a scale typically ranging from 0 to 50 ppt, they require just a few drops of water to provide a reading. To use one, place the water sample on the device's prism, look through the viewfinder, and read the salinity directly from the scale.
Conductivity probes, on the other hand, provide quicker readings across multiple locations. These devices measure how well water conducts electricity, which correlates with salt levels. When choosing a probe, look for one with Automatic Temperature Compensation (ATC) to account for temperature-related changes.
"Salinity is an important water parameter to measure in terms of water quality as different crops, livestock, and aquatic organisms require different salinity environments to survive."
To ensure accurate readings with conductivity probes, gently tap or move the device to remove air bubbles from the electrodes, as these bubbles can interfere with measurements.
Data Loggers for Long-Term Tracking
For continuous monitoring, automated data loggers are a game-changer. These devices provide around-the-clock surveillance of oyster beds, recording salinity, temperature, and dissolved oxygen at regular intervals - typically every 30 to 60 minutes. Many models can also send data to real-time dashboards for instant access.
For example, in 2023, Florida's Oyster FARMS network used In-Situ Aquatroll 100 data loggers in locations like Alligator Harbor and Pensacola Bay. These loggers were placed directly in oyster bags, recording temperature and salinity hourly. Data could then be downloaded via Bluetooth for quick action during mortality events. Near Cedar Key, monitoring stations at Dog Island and Gulf Jackson deployed In-Situ Aqua TROLL 600 sondes, which take measurements every 30 minutes and upload the data every two hours via HydroVu Data Services. Unlike spot checks, these tools provide insights into seasonal changes and environmental factors affecting oyster health.
Calibration Kits for Accuracy
Regular calibration is essential to keep your measurements reliable. Without it, you risk errors like offset miscalibration (readings consistently too high or low) or slope miscalibration (errors that worsen as measurements stray from the calibration point). Calibration kits typically include a standard solution - often a 35 ppt seawater standard - that helps recalibrate devices effectively. While some tools allow for calibration with pure water (0 ppt), a 35 ppt solution is better suited for marine environments.
Salinity meters should be calibrated every three to four months, depending on usage. When calibrating electronic probes, use a plastic container to avoid electromagnetic interference and let the solution reach room temperature for better stability. If probes are left submerged in oyster beds, clean them regularly with a soft brush and reverse osmosis water to remove slime or debris that can impact accuracy. Consistent calibration not only improves data quality but also ensures the reliability of your monitoring efforts.
| Tool Type | Primary Function | Best Use Case | Typical Cost |
|---|---|---|---|
| Refractometer | Measures light refraction | Quick manual spot checks | $50–$150 |
| Conductivity Probe | Measures electrical current | Instant digital readings; multi-site monitoring | $109.99–$201.99 |
| Data Logger/Sonde | Continuous automated recording | Long-term trend analysis; mortality tracking | $500–$2,000+ |
| Calibration Kit | Maintains equipment accuracy | Regular equipment maintenance | $20–$50 |
Weekly Salinity Monitoring Checklist
Keeping a close eye on salinity levels every week is essential for managing oyster health, both in the short term and over the long haul. A well-organized checklist ensures you're gathering meaningful data that reflects the conditions your oysters experience, helping you make informed decisions for better farming outcomes.
Choose Monitoring Locations
Pick monitoring spots that are directly in or near your active oyster beds. This ensures the data you collect mirrors the actual environment your oysters are exposed to. For instance, in places like the Little Wicomico River, setting up stations in different zones - such as mid-river, headwaters, and open areas - can help you capture salinity variations. Make sure each site has at least one foot of water at low tide to keep oysters submerged and filtering effectively. Also, choose locations sheltered from boat wakes to protect your equipment and oysters.
"We routinely monitor and test water quality to pinpoint the prime times for harvesting batches with optimal saltiness, sweetness, and texture."
- Little Wicomico Oyster Company
Measure Salinity at Consistent Depths
Always take salinity readings at the bottom of the water column where the oysters live, not at the surface. For example, in October 2024, the Severn River Association recorded a bottom salinity of 12.42 ppt at a depth of 3.5 meters (about 11.5 feet) at the Peach Orchard oyster reef, showing how readings can vary with depth. Surface measurements can differ by as much as 3 ppt, so sticking to the same bottom depth ensures consistency and comparability.
Record Salinity and Temperature
Log key metrics like salinity (ppt), water temperature, and dissolved oxygen levels. Temperature is important because colder water holds more oxygen, which is critical for oyster health. Conduct your measurements during the same time window each week - say, Wednesday through Friday mornings - to maintain consistency and make trend analysis easier. Don’t forget to record the exact depth of each reading to account for any water column stratification.
Observe Oyster Behavior
Take note of how your oysters are reacting to the current conditions. If their valves are actively opening and closing, they’re filtering and growing as expected. However, if they appear sluggish or their valves remain closed, it could signal salinity stress. During your weekly visits, also check for overcrowding. If oysters are packed too tightly, you may need to manually separate them to ensure each one has enough space to filter-feed properly.
Identify and Address Unusual Readings
Flag any salinity readings that drop below 8 ppt - oysters can’t grow at these levels, and their survival may be at risk. If salinity consistently falls outside the ideal range of 10–20+ ppt, you might need to consider relocating your cages to a better site. Similarly, watch for dissolved oxygen levels below 2 mg/L. The Severn River Association has identified "dead zones" in areas like Mill Creek and Indian Landing headwaters, where low oxygen levels can threaten oyster health. Always double-check unusual readings with a hydrometer before making adjustments to your strategy or equipment.
Here’s a quick reference table to understand how salinity impacts oyster health:
| Salinity Level | Impact on Oyster Health and Growth |
|---|---|
| Below 8 ppt | Growth stops; survival is at risk |
| 8–10 ppt | Growth happens, but at a slower rate |
| 10–20+ ppt | Ideal range for peak growth |
Seasonal Salinity Targets and Monitoring Frequency
Salinity levels naturally fluctuate throughout the year, and your monitoring schedule should reflect these seasonal changes. For instance, in many tidal areas, salinity can dip to 10 ppt during winter and rise to 25 ppt by late summer due to increased evaporation and reduced rainfall. Recognizing these patterns allows you to better predict when your oysters may be at risk or set for optimal growth. Adjusting your monitoring routine accordingly ensures better protection for your oysters.
From spring through fall, monitoring should be more frequent. This is the critical spawning season when rising water temperatures and salinity trigger oyster spawning. During the peak months of June and July, daily monitoring is essential. Use continuous data loggers to ensure salinity stays within the ideal range of 14–28 ppt, which supports larval development and successful spat settlement. Once larvae attach to a substrate and transition to spat, maintaining consistent salinity becomes even more important for their survival.
In the winter months, a less intensive monitoring schedule is usually sufficient, but don’t let your guard down. Heavy rainfall or runoff can lower salinity below the 8 ppt threshold, which is the minimum needed for growth. Additionally, while colder water holds more dissolved oxygen (a benefit), sub-freezing air temperatures can be deadly if oysters are exposed during low tides. Keep oysters submerged at least one foot below the surface to protect them from freezing conditions.
Late summer brings its own challenges. Higher salinity levels (above 20 ppt) promote growth, but levels consistently exceeding 30 ppt can lead to increased risks of disease and predation. To safeguard juveniles, aim to keep salinity in seedbeds between 15–18 ppt, while mature oysters can be moved to waters with salinity above 20 ppt for final growth. These adjustments, combined with regular monitoring, help reduce disease risks during this period.
After extreme weather events, check salinity immediately. If levels drop below 5 ppt and stay low for several days, expect high mortality rates. In such cases, relocate oyster cages quickly to minimize losses.
Conclusion
Keeping a close eye on salinity levels is key to thriving oyster farming. Oysters require at least 8 ppt of salinity to grow, with an optimal range being even higher. Without consistent monitoring, oysters face risks like slower growth, increased disease, and even large-scale die-offs.
This simple but crucial practice shapes every aspect of farm management.
By using your monitoring tools and checklist, you can turn salinity data into actionable steps. Decades of research show that understanding how salinity interacts with temperature and changes seasonally is vital for creating management strategies that suit your specific location. Regular, accurate measurements allow you to act quickly - whether that means relocating cages during high-salinity periods or taking emergency steps during freshwater surges - and also help fine-tune your long-term farming practices.
With the right tools and consistent tracking, you’ll not only grow healthier oysters but also minimize disease risks and improve productivity. For Virginia’s estuarine environments, this method ensures a steady supply of premium oysters, as demonstrated by the success of Little Wicomico Oyster Co., where careful monitoring supports year-round excellence.
FAQs
What causes salinity to change so quickly in oyster beds?
Salinity levels in oyster beds can change quickly due to several environmental factors. High temperatures often lead to increased evaporation, concentrating salts in the water. Drought conditions can reduce the flow of freshwater, further elevating salinity. Additionally, saltwater intrusion from rising sea levels introduces more saltwater into coastal regions, altering the delicate balance of oyster habitats.
How do I know when salinity stress is harming my oysters?
Signs of salinity stress in oysters can show up in several ways. These include immune system disruptions, higher death rates following sudden drops in salinity, and noticeable physiological changes. For instance, oysters may experience cell swelling, fewer gill cilia, and an increase in apoptotic (or dying) cells. Such problems are particularly frequent when salinity levels fall below 15 ppt.
How can I choose the best salinity-monitoring tool for my farm?
To choose the best salinity-monitoring tool for oyster farming, focus on devices that measure salinity in parts per thousand (ppt) - the standard unit in this field. Opt for tools equipped with conductivity sensors (either toroidal or contact) that can accurately handle salinity levels between 10–25 ppt and offer real-time readings. Additionally, ensure the device is built to last, is easy to calibrate, and performs well in field conditions to ensure consistent accuracy over time.


